Project:
Re-designing ABS
Client:
ABS
Activities:
Visual design, Prototyping
Year:
2017 (1.5-week project)
Background
A digital overhaul on Australian Bureau of Statistics (ABS) website to allow a service that put their customers at the centre, a relevant, easily understandable and usable digital-first service. Salsa Digital, a development house specialising in Drupal CMS was engaged to build the new ABS website.
ABS has conducted their own discovery process; defining their customers and identifying their pain points in their journey. After series of customer interviews and workshops with internal staff and stakeholders, the ABS team identified 6 user personas and mapped them against a task/context spectrum based on various factors such as time, frequency, impact, data customisation, analysis requirements, etc.
From that, they came up with several concepts that would meet customers expectations. Some of the concepts explored for the alpha release are:
- Key indicators
- Topic page
- Visual data explorer
My role
Before I came onboard, the previous Visual Designer had started designing the concepts. They were incorporated into Invision prototype for ABS to test with their customers.
My task was to look at the feedback from usability testing and implement required changes; take it to the next step for alpha build and further testing.
Approach
To get the concepts ready for alpha build, I did the following:
- Aligned the design as per DTA Design Guide required for Australian Government websites.
- Implemented changes as per feedback from usability testing.
- Defined chart/table component.
Design alignment & changes
As an independent statistical agency of the Government of Australia, ABS has to follow the guidelines perscribed by Digital Transformation Agency (DTA). The Guide specifies details on various HTML elements and components styling such as lists, accordions, forms & buttons to be used.
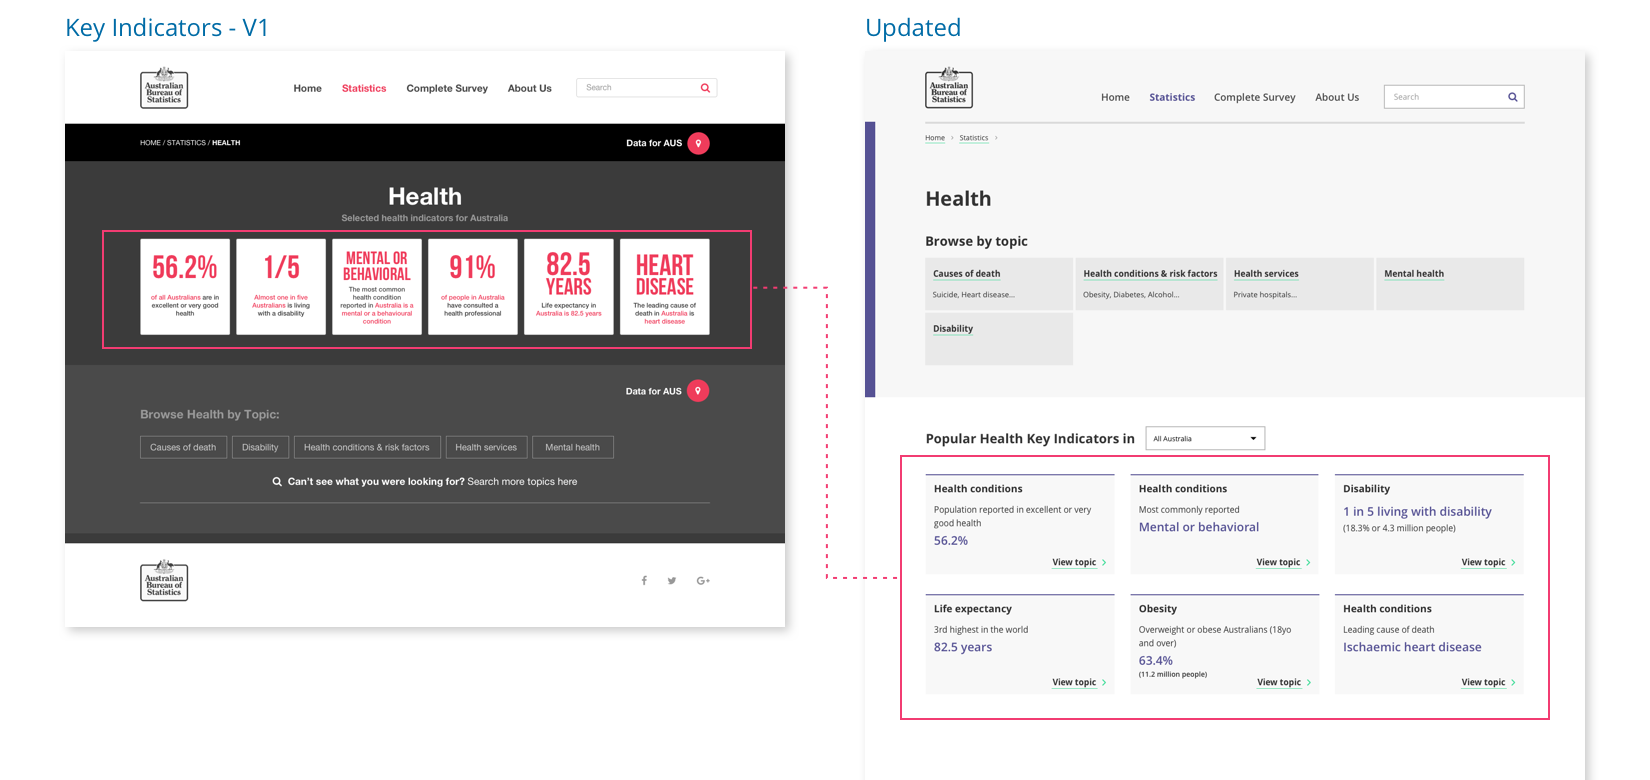
To make the content easier to read, centred text was also changed to left aligned text. The inconsistent display of the Key Indicators (font sizes, data measurements, context) in initial design was supported by usability testing and needed to be standardised. This is particularly important as series of key indicators will be displayed per Theme and they needed to be easily understood.
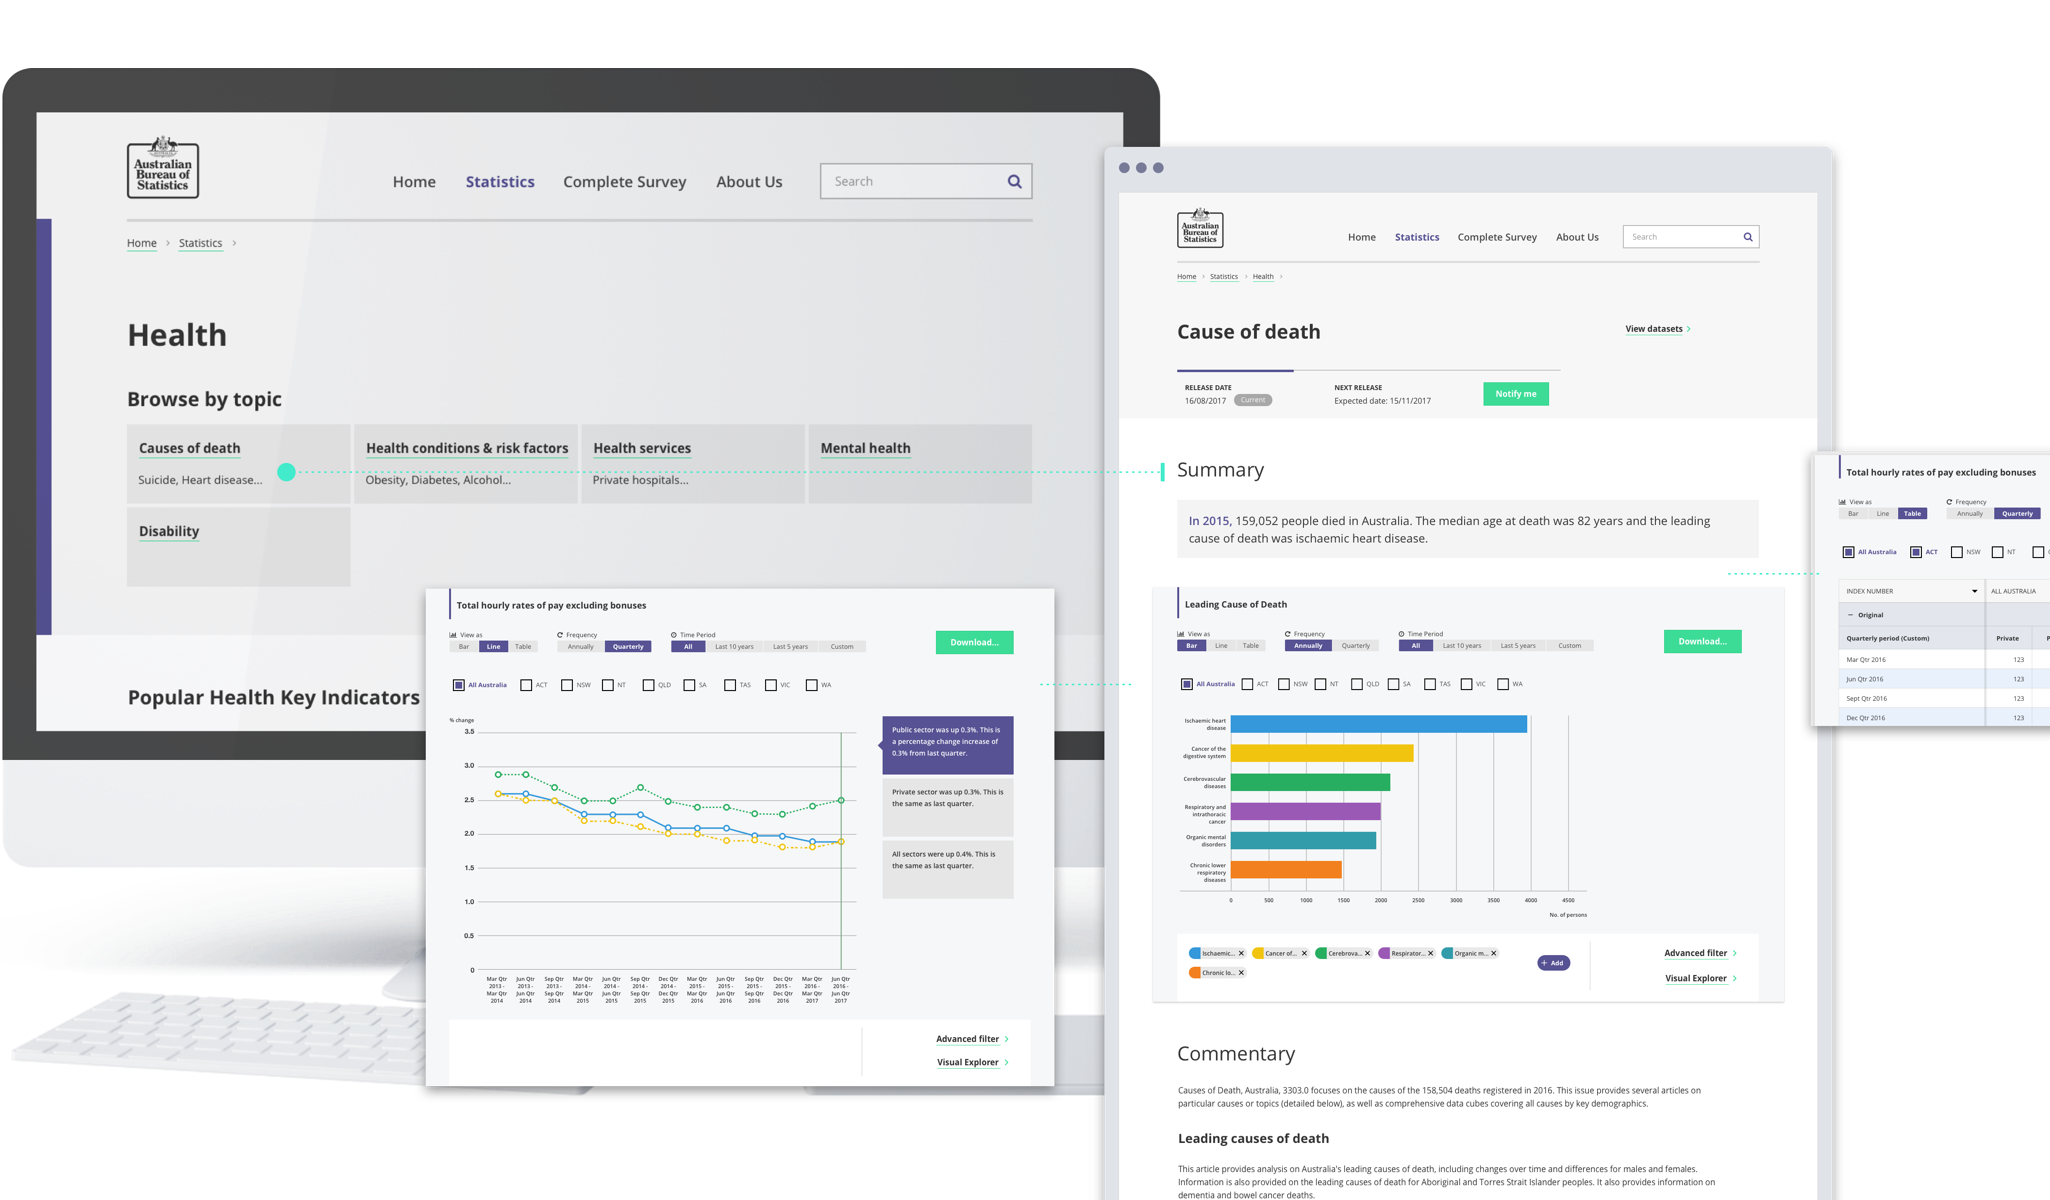
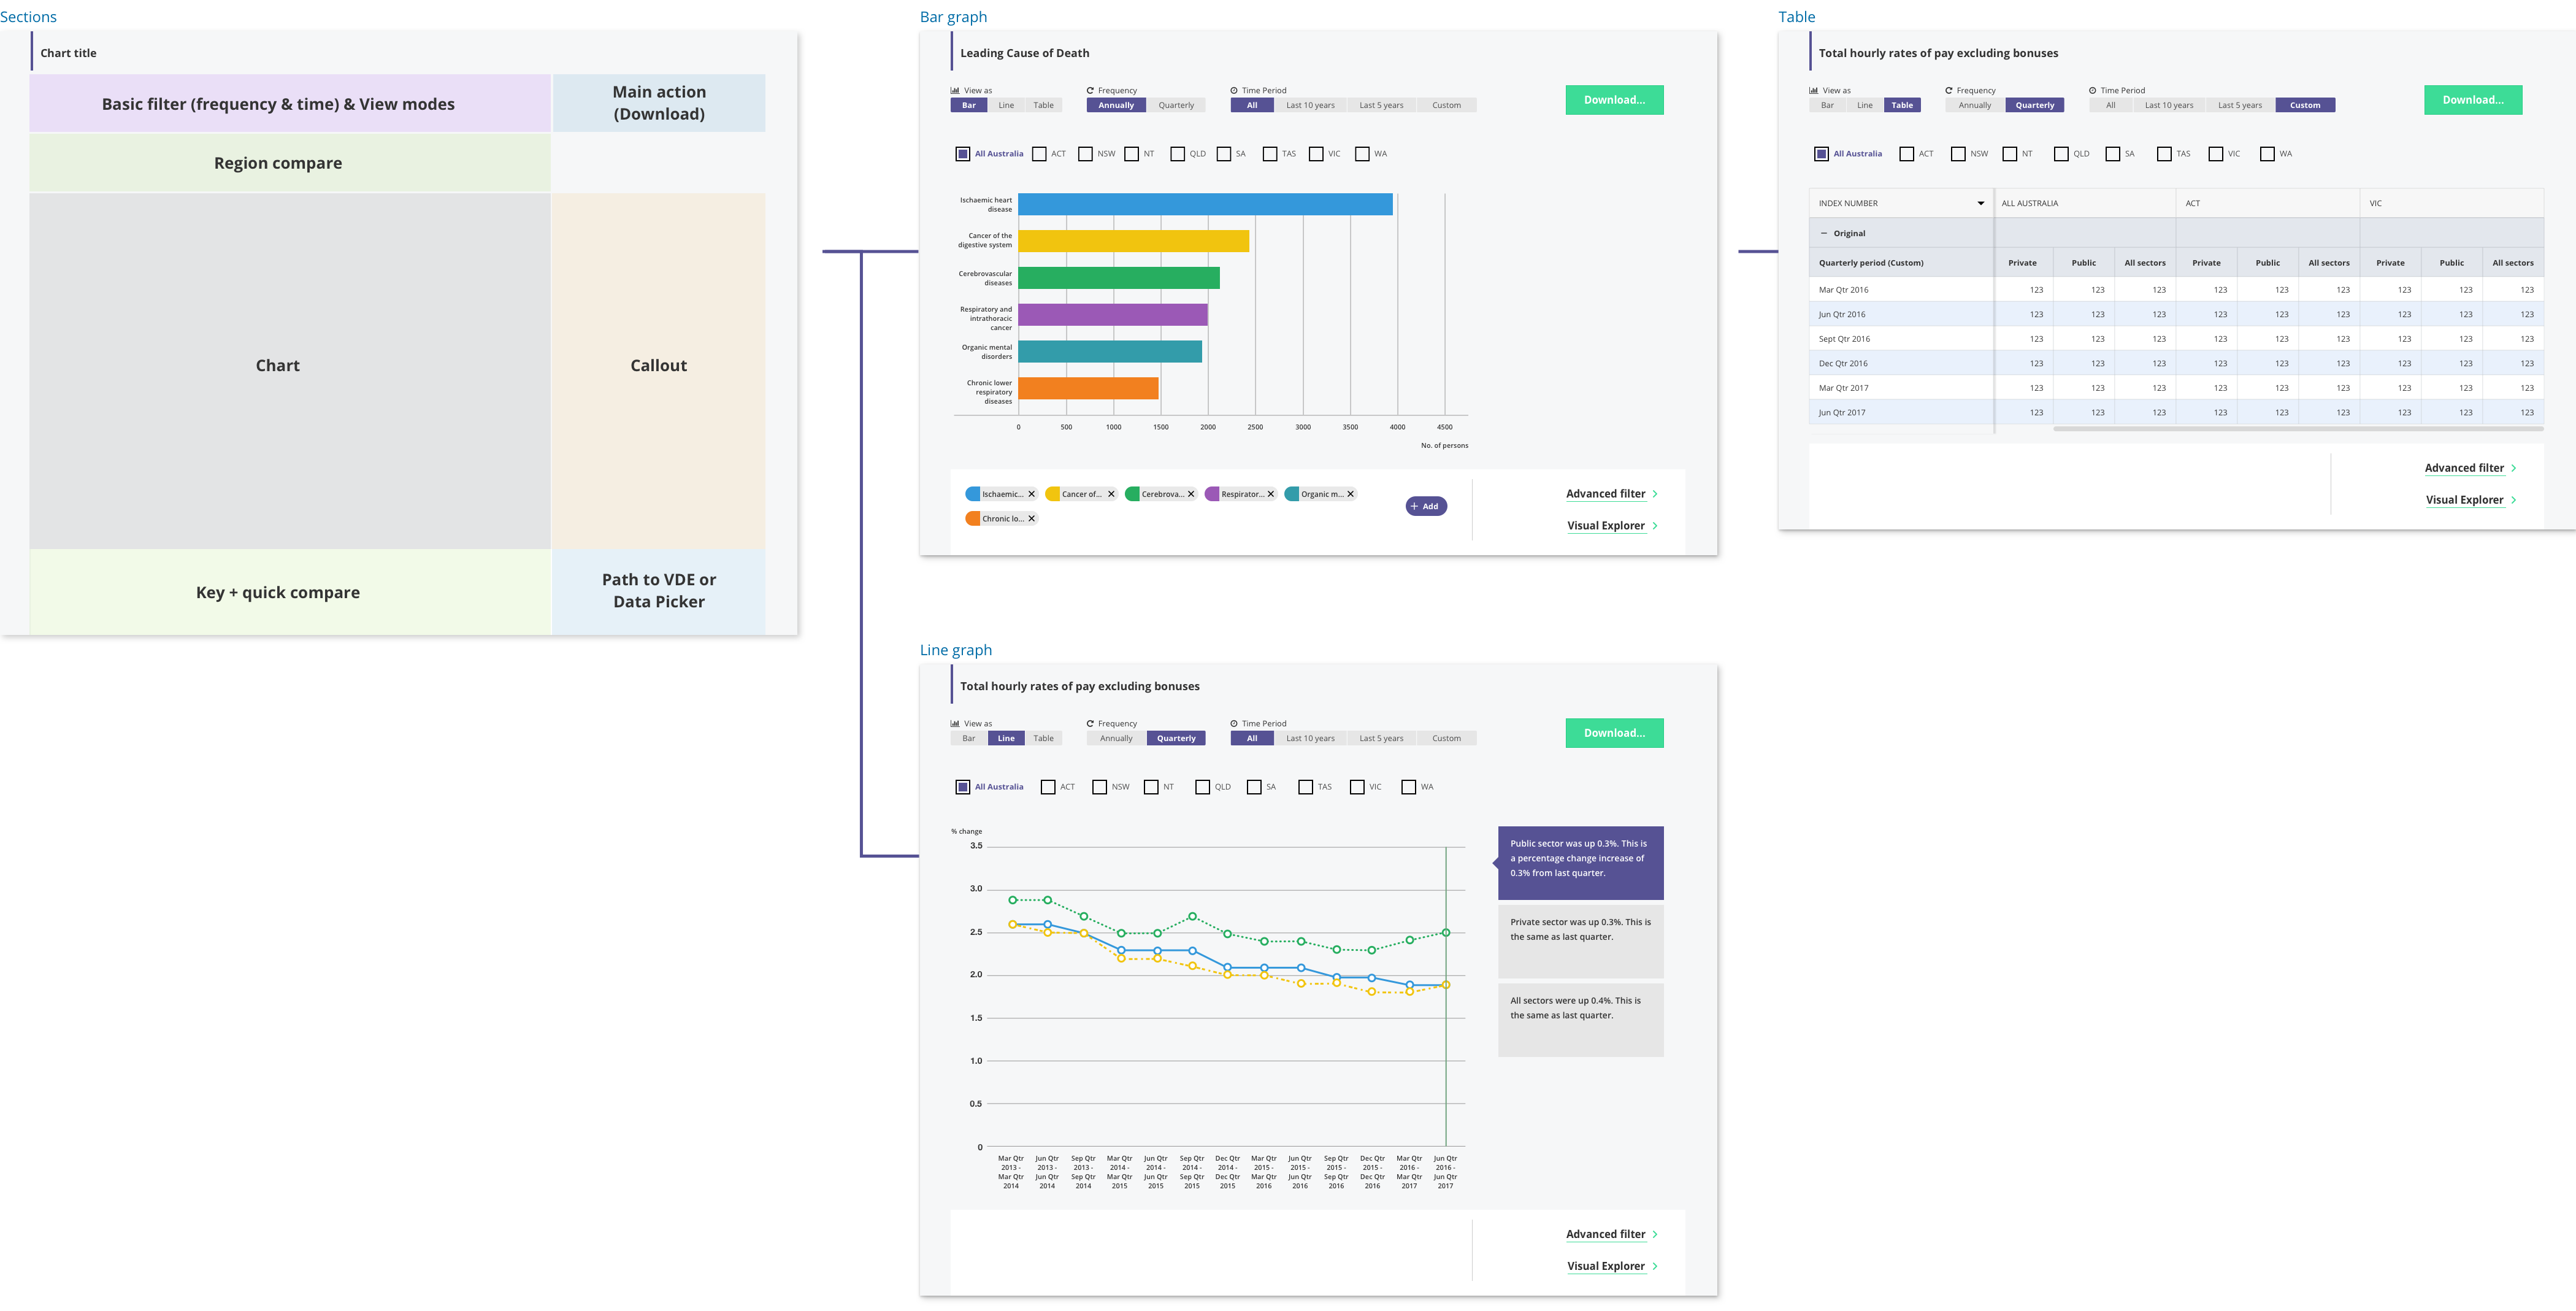
Defining chart component
Charts/tables are key components and used by customers throughout ABS website, they serve as first point of data customisation in a Topic page. Therefore, not only sections of the chart component need to be defined and standardised, their functions need to be defined as well.
Standardisation helps development effort, at the same time it helps familiarity with users.
Next step...
The updated design satisfied the requirement for alpha build and development is expected to be finished by the end of December 2017. After that, the project will continue with further iteration and exploration of other concepts.